Only the ProxCard and Remote Auth tabs are applicable when installing the Passthrough only server option.
The server status monitoring tool will start automatically when logged into the server hosting the ExactAccess server product. This tool provides a view of the statistics of the running ExactAccess server instance, similar to the performance monitor provided within Windows®.
The main window displays the server connection information for each of the server services.
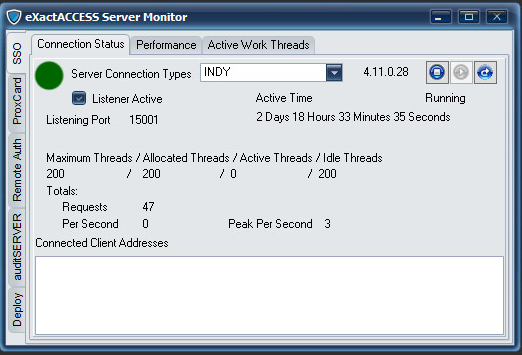
The list box on the right of the screen will list active connections for the protocol type, while the statistics for the currently selected protocol are displayed on the left portion of the screen. Similar to the Microsoft performance monitor, the information will be updated on a periodic basis. The green "dot" in the upper left indicates the connection state of the monitor tool. If the management port is disabled, or the monitor tool is unable to contact the XA server, a red dot will appear, indicating that the service could not be contacted.
Selecting the "Performance" tab will display a grid for each enabled protocol. The grid will display the requests per-second over the last minute of server operation. This enables an administrator to gauge the utilization of the server for each of the active services.
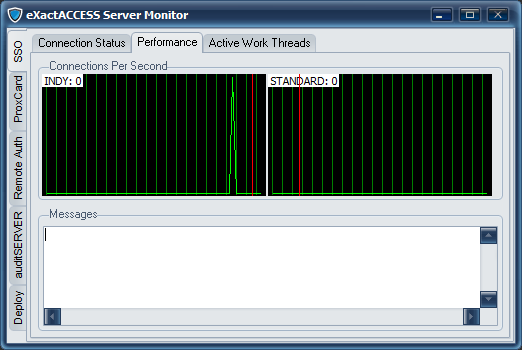
The "messages" field will display the tool connection status or errors received from the server.
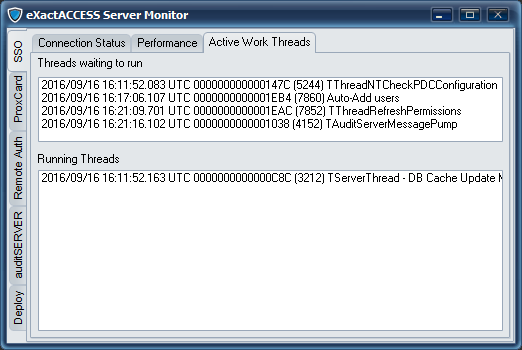
Selecting the "Active Work Threads" tab will show the status of some of the internal processes of the XA server. This can give some insight on the performance of auto-add or database synchronization on the installed server.